You have the data spine. The next join is the customer-shape across your books.
If you have consolidated your lake, unified your quote-and-buy across brands, and put an LLM on the call floor, the digital-operations spine is in. That is the current-phase story. This page is about what sits above it, and why the 5% who compound it into growth do so on a query layer rather than a replatform.
The 5% of insurers who connected their customer-shape into growth earned 6.1x the shareholder return of the rest.1 They did not build it by rebuilding the warehouse. They built it on the query layer above the lake they already owned. The joins that matter are the ones SQL over the lake was never shaped to do: one household across product lines, one broker's introducer economics across the book, one fraud ring living in the seam between two brands. These are also the joins where cross-brand growth becomes visible to the board reading the integration story.
The pattern the 5% used: a semantic overlay - a customer ontology expressed as a graph - working direct against the Policy Admin System or over the warehouse if one is already in place. No replatform. No warehouse dependency. The overlay sits above the transactional systems and asks the questions they were never shaped for.
1 McKinsey, The Future of AI in the Insurance Industry, July 2025 (AI-leaders vs laggards, 5-year TSR).
Not because they bought better AI. Because the AI could see what it needed to see.
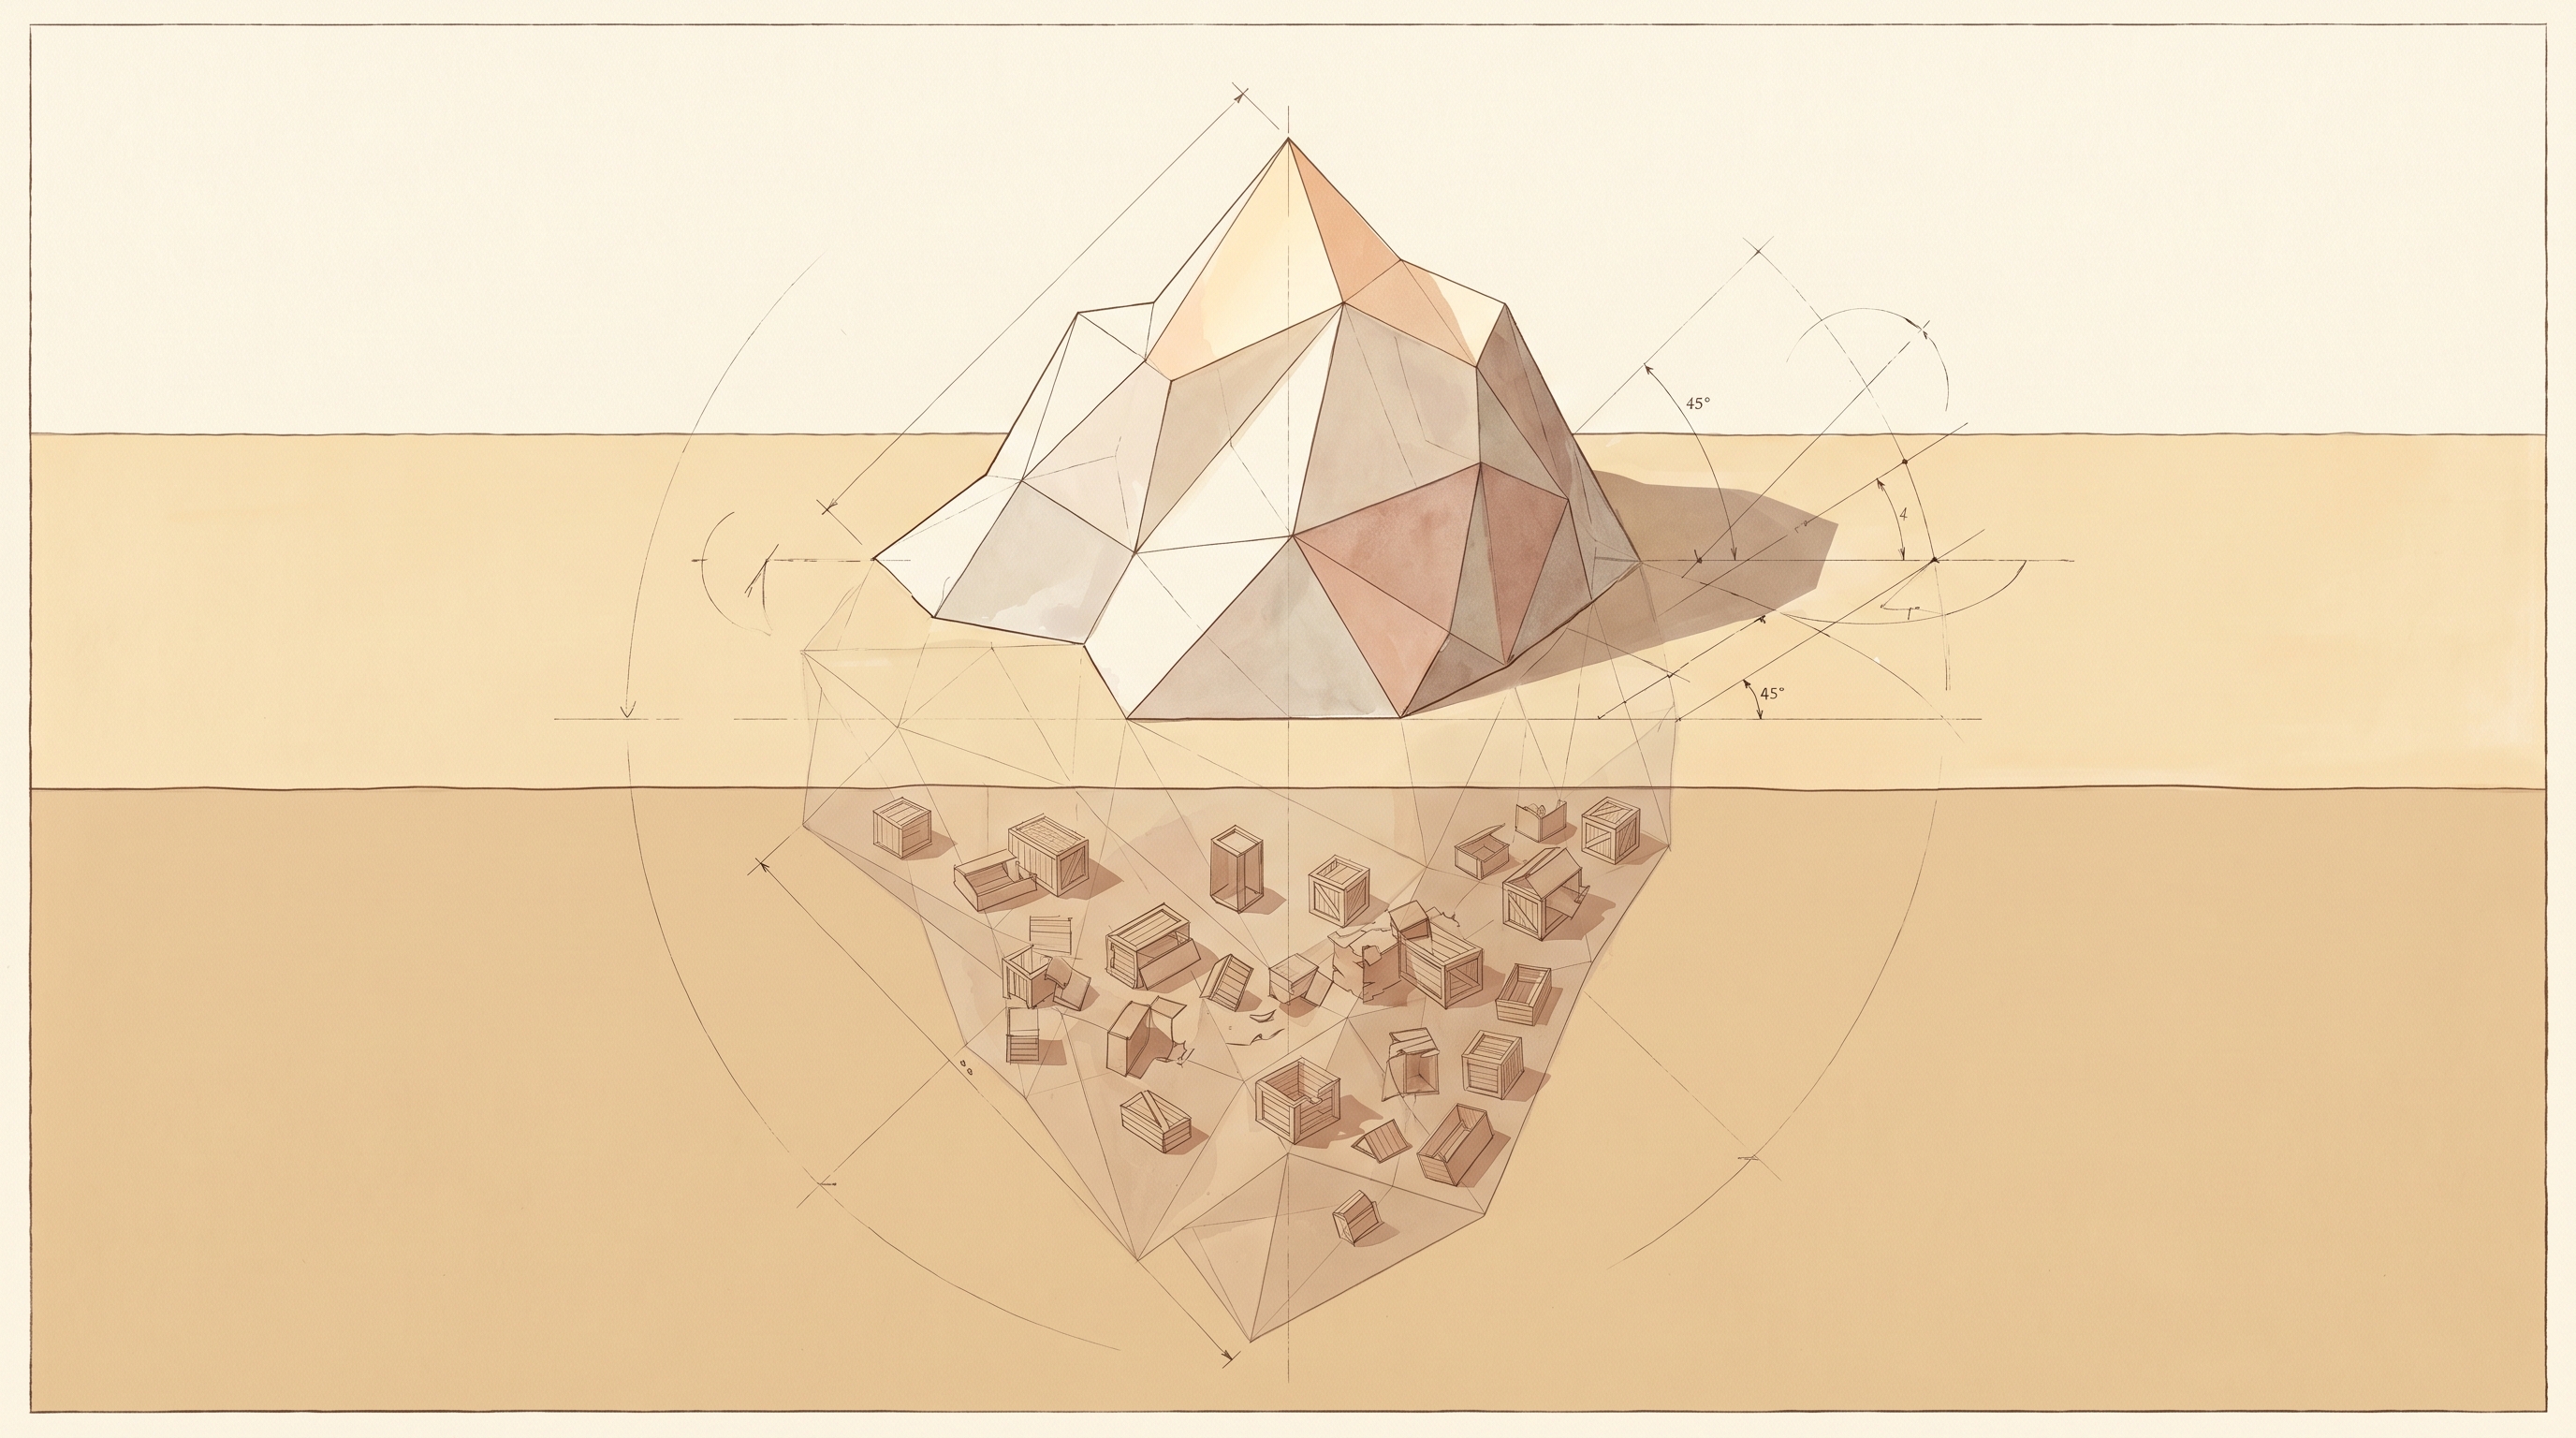
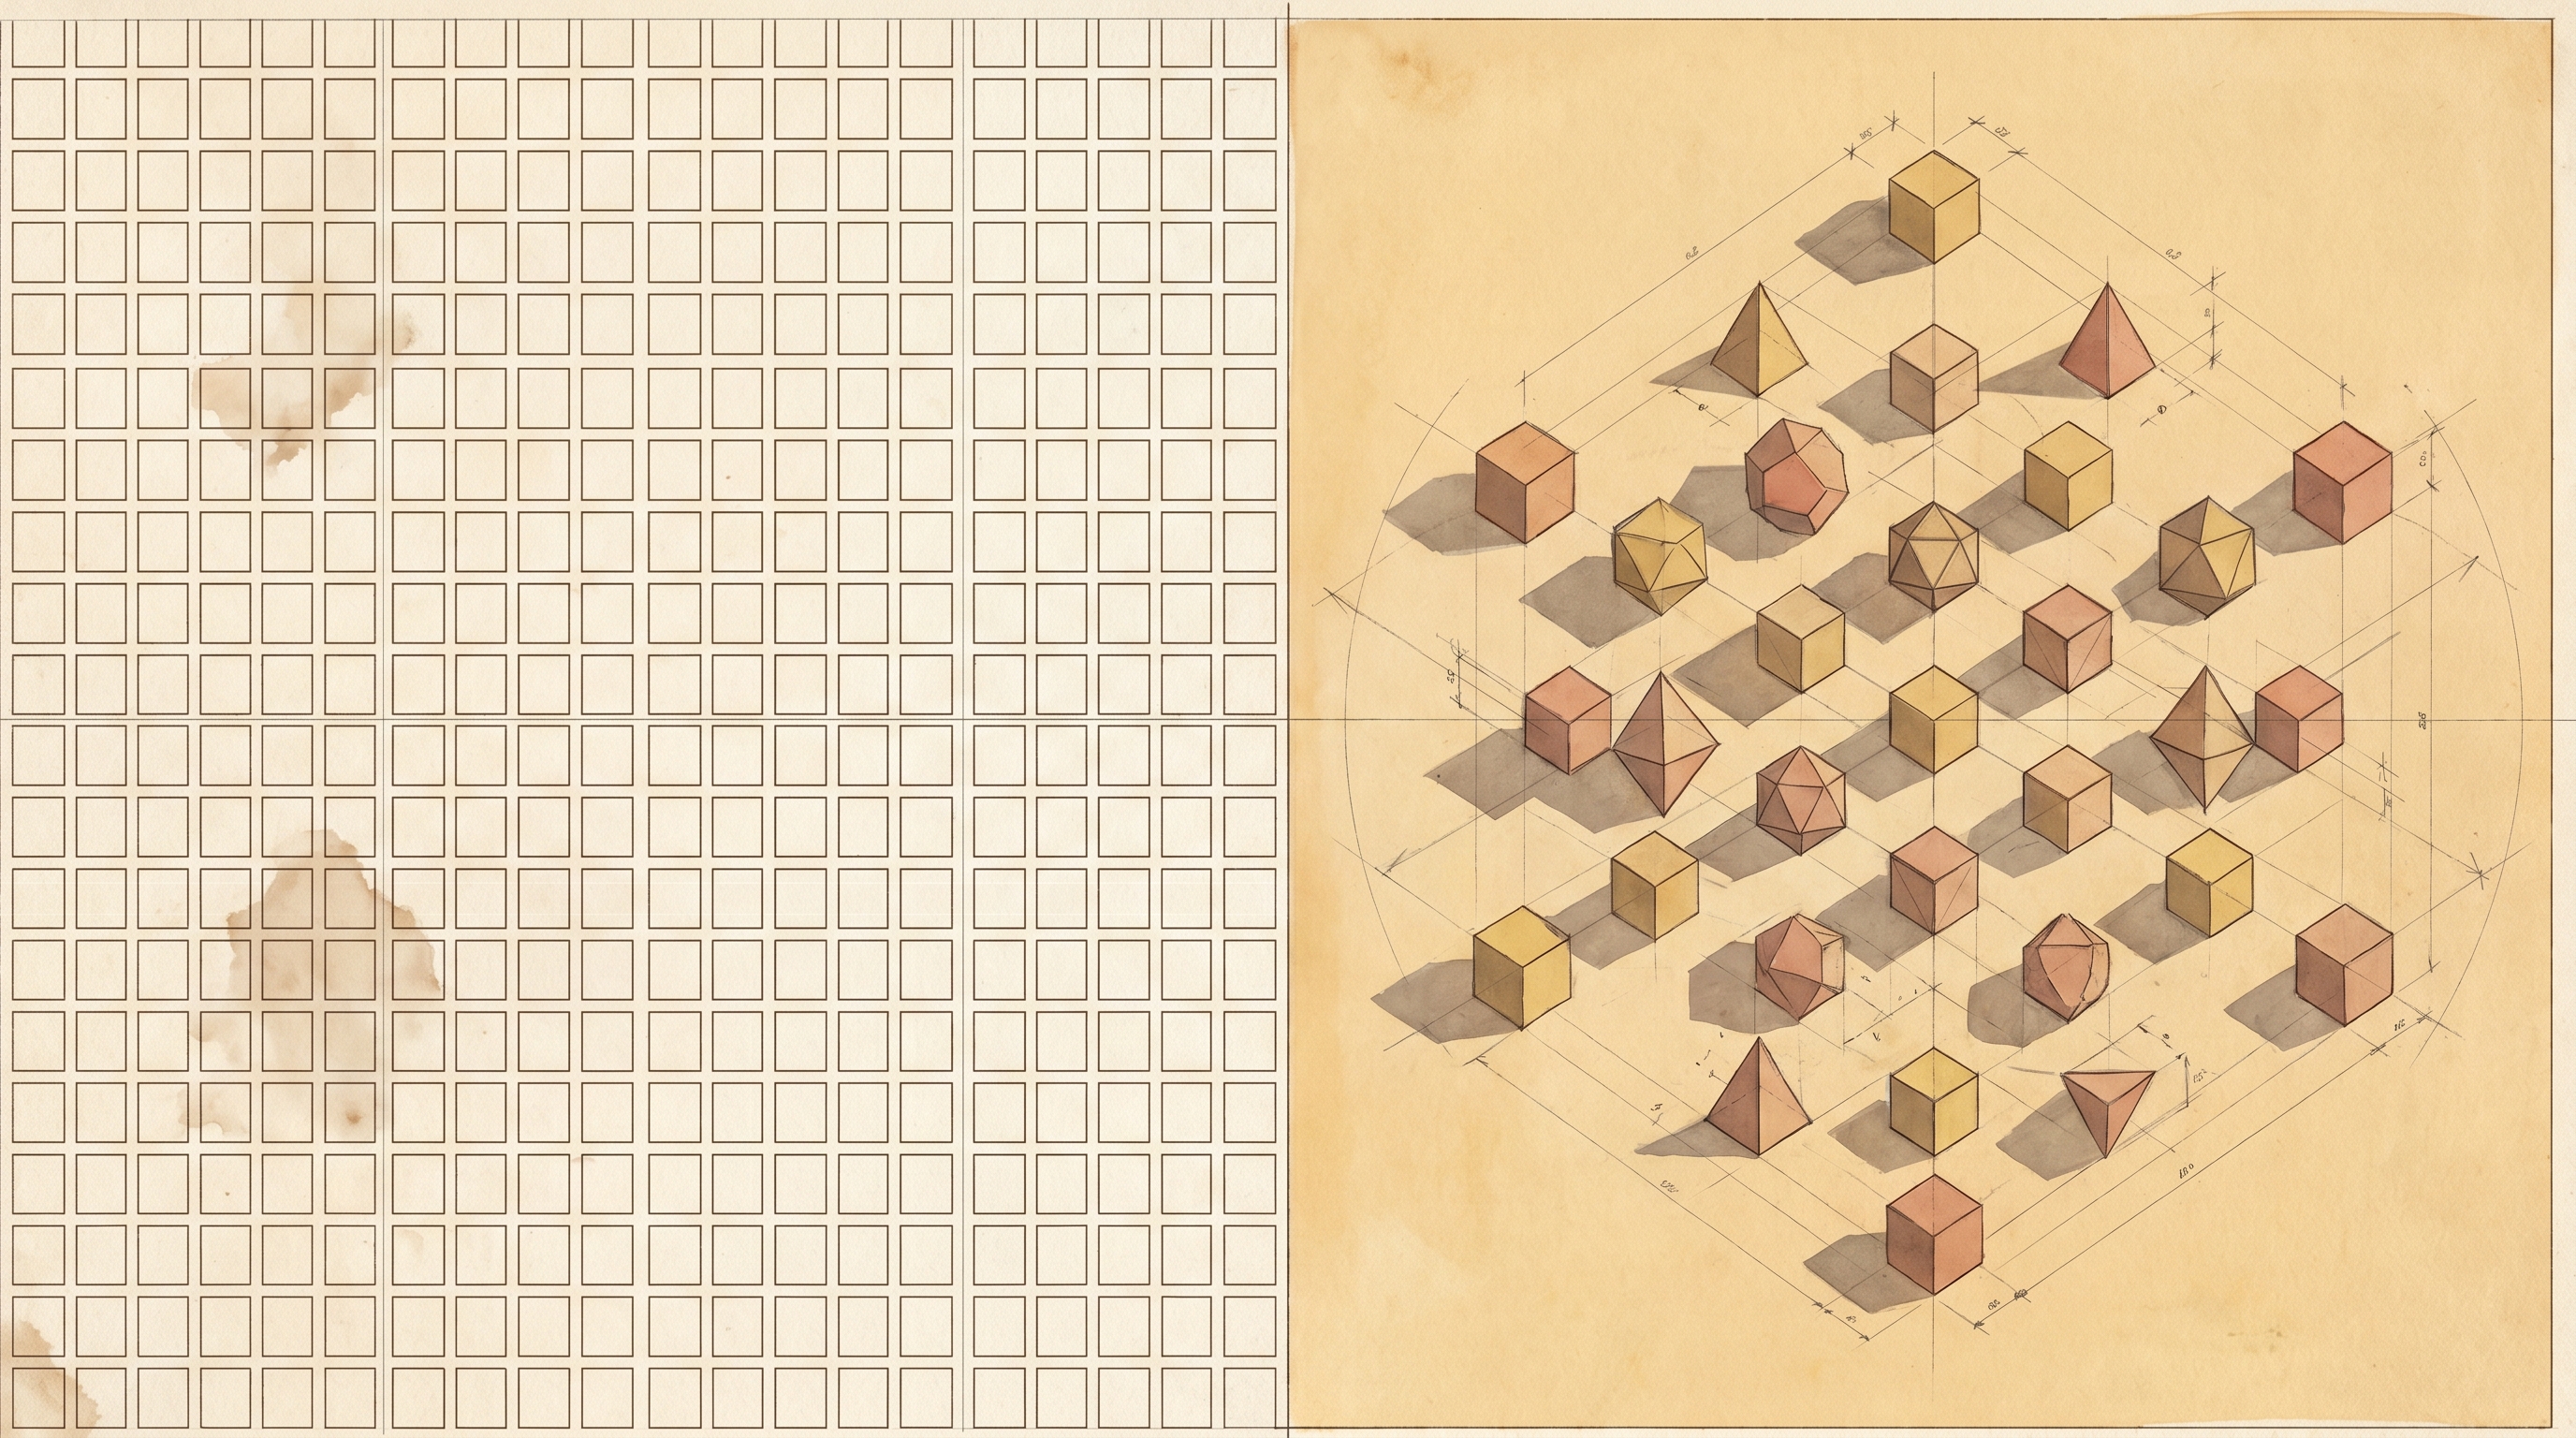
The lake gives you tabular truth. The semantic overlay - a customer ontology expressed as a graph - gives you the joins the tables were never shaped for: household resolution across products, network structure across brokers, and the seams where fraud lives between books. An overlay, not a replatform. It sits above the systems you already own and answers the questions SQL over the tables does slowly or not at all.
Graph databases have been in production under regulated financial workloads longer than generative AI has existed. The technology is proven. Where it earns its place is on the specific cross-book joins the pricing lake was not shaped to answer.
The technology is already in production across regulated finance. The infrastructure sits alongside your existing systems, not inside them. DPO signs off on the specific PII scope. The customer ontology can point direct at the Policy Admin System, or at the warehouse if one is in place. Either way, the transactional systems are untouched and the join answers the questions the tables were never shaped to hold.
Companies That Did This
Built one connected view of each customer. Pointed 80 AI models at it. Result: GBP 233M fraud detected in one year. Claims routing 30% faster. Liability assessment 23 days shorter. They did not buy a magic box. They connected what they already had.
Revenue up 29% in one year. They connected every driver to their driving behaviour, their risk profile, and their policy in one live view. The underwriter sees the whole picture. The pricing reflects reality. Customers stay because the price is fair.
AI read the claim, checked the policy, ran 18 fraud algorithms, and paid the money. No human touched it. This was possible because the policy, the claim history, and the fraud signals were all connected in one place. The AI did not guess. It looked things up.
Premium growth 3 points higher. These are not startups. These are established insurers who connected their existing data across departments. Same people, same systems, better wiring.
Every one of these companies did the same thing: they built a query layer that let their people and their AI see the whole customer in one place. Above the warehouse they already owned. That is the 5%.
The Customer360 Gap
Better fraud detection, accurate risk selection (flood, telematics, household), higher retention, faster claims. Every one of these improves your combined ratio and gives you more room on pricing. The 5% built the customer-shape as a query layer above the lake they already owned. The rest of this page is that pattern.
One Customer
Today: Janet has motor with one of your brands, pet insurance with another, and home with a third. None of these systems know about the others. Her renewal goes out at standard rate. No bundle offer. No flood risk adjustment. A competitor offers her motor and home together for less. She leaves. You lose the household across three brands.
After: the underwriter opens one screen and sees all three policies, the address near the flood plain, and the renewal due date. The bundle offer goes out with the renewal. The flood risk is priced correctly. Janet stays - because staying is easier than shopping and the offer reflects who she actually is.
Your Teams Already Carry It
Your underwriters, claims handlers, and pricing analysts already carry the connections in their heads. The underwriter knows Janet has three policies. The claims handler knows which broker introduced her. The pricing analyst knows the household. The knowledge is in the workflow; what is missing is the query layer that shows what they already know to the systems around them.
The 5% did not replace their people with AI. They gave the AI a view that matches what the people already understand.
So why has most of the industry not done it? Not skill. Not budget. The reason it takes longer than the technology suggests is that connecting the data crosses the ownership lines drawn during acquisitions. The 5% negotiated across those lines because the compound growth was visible. The rest waited for permission.
The graph is the shape your teams already run in their heads.
What you are adding is the query layer so the systems around them can answer the same questions in the same shape. The data exists. The people exist. The lake exists. The join is the last mile.
The Shape the 5% Used
Three components. Not proprietary. Not a methodology to be procured. The knowledge is here so your team can build it.
The semantic overlay (a customer ontology)
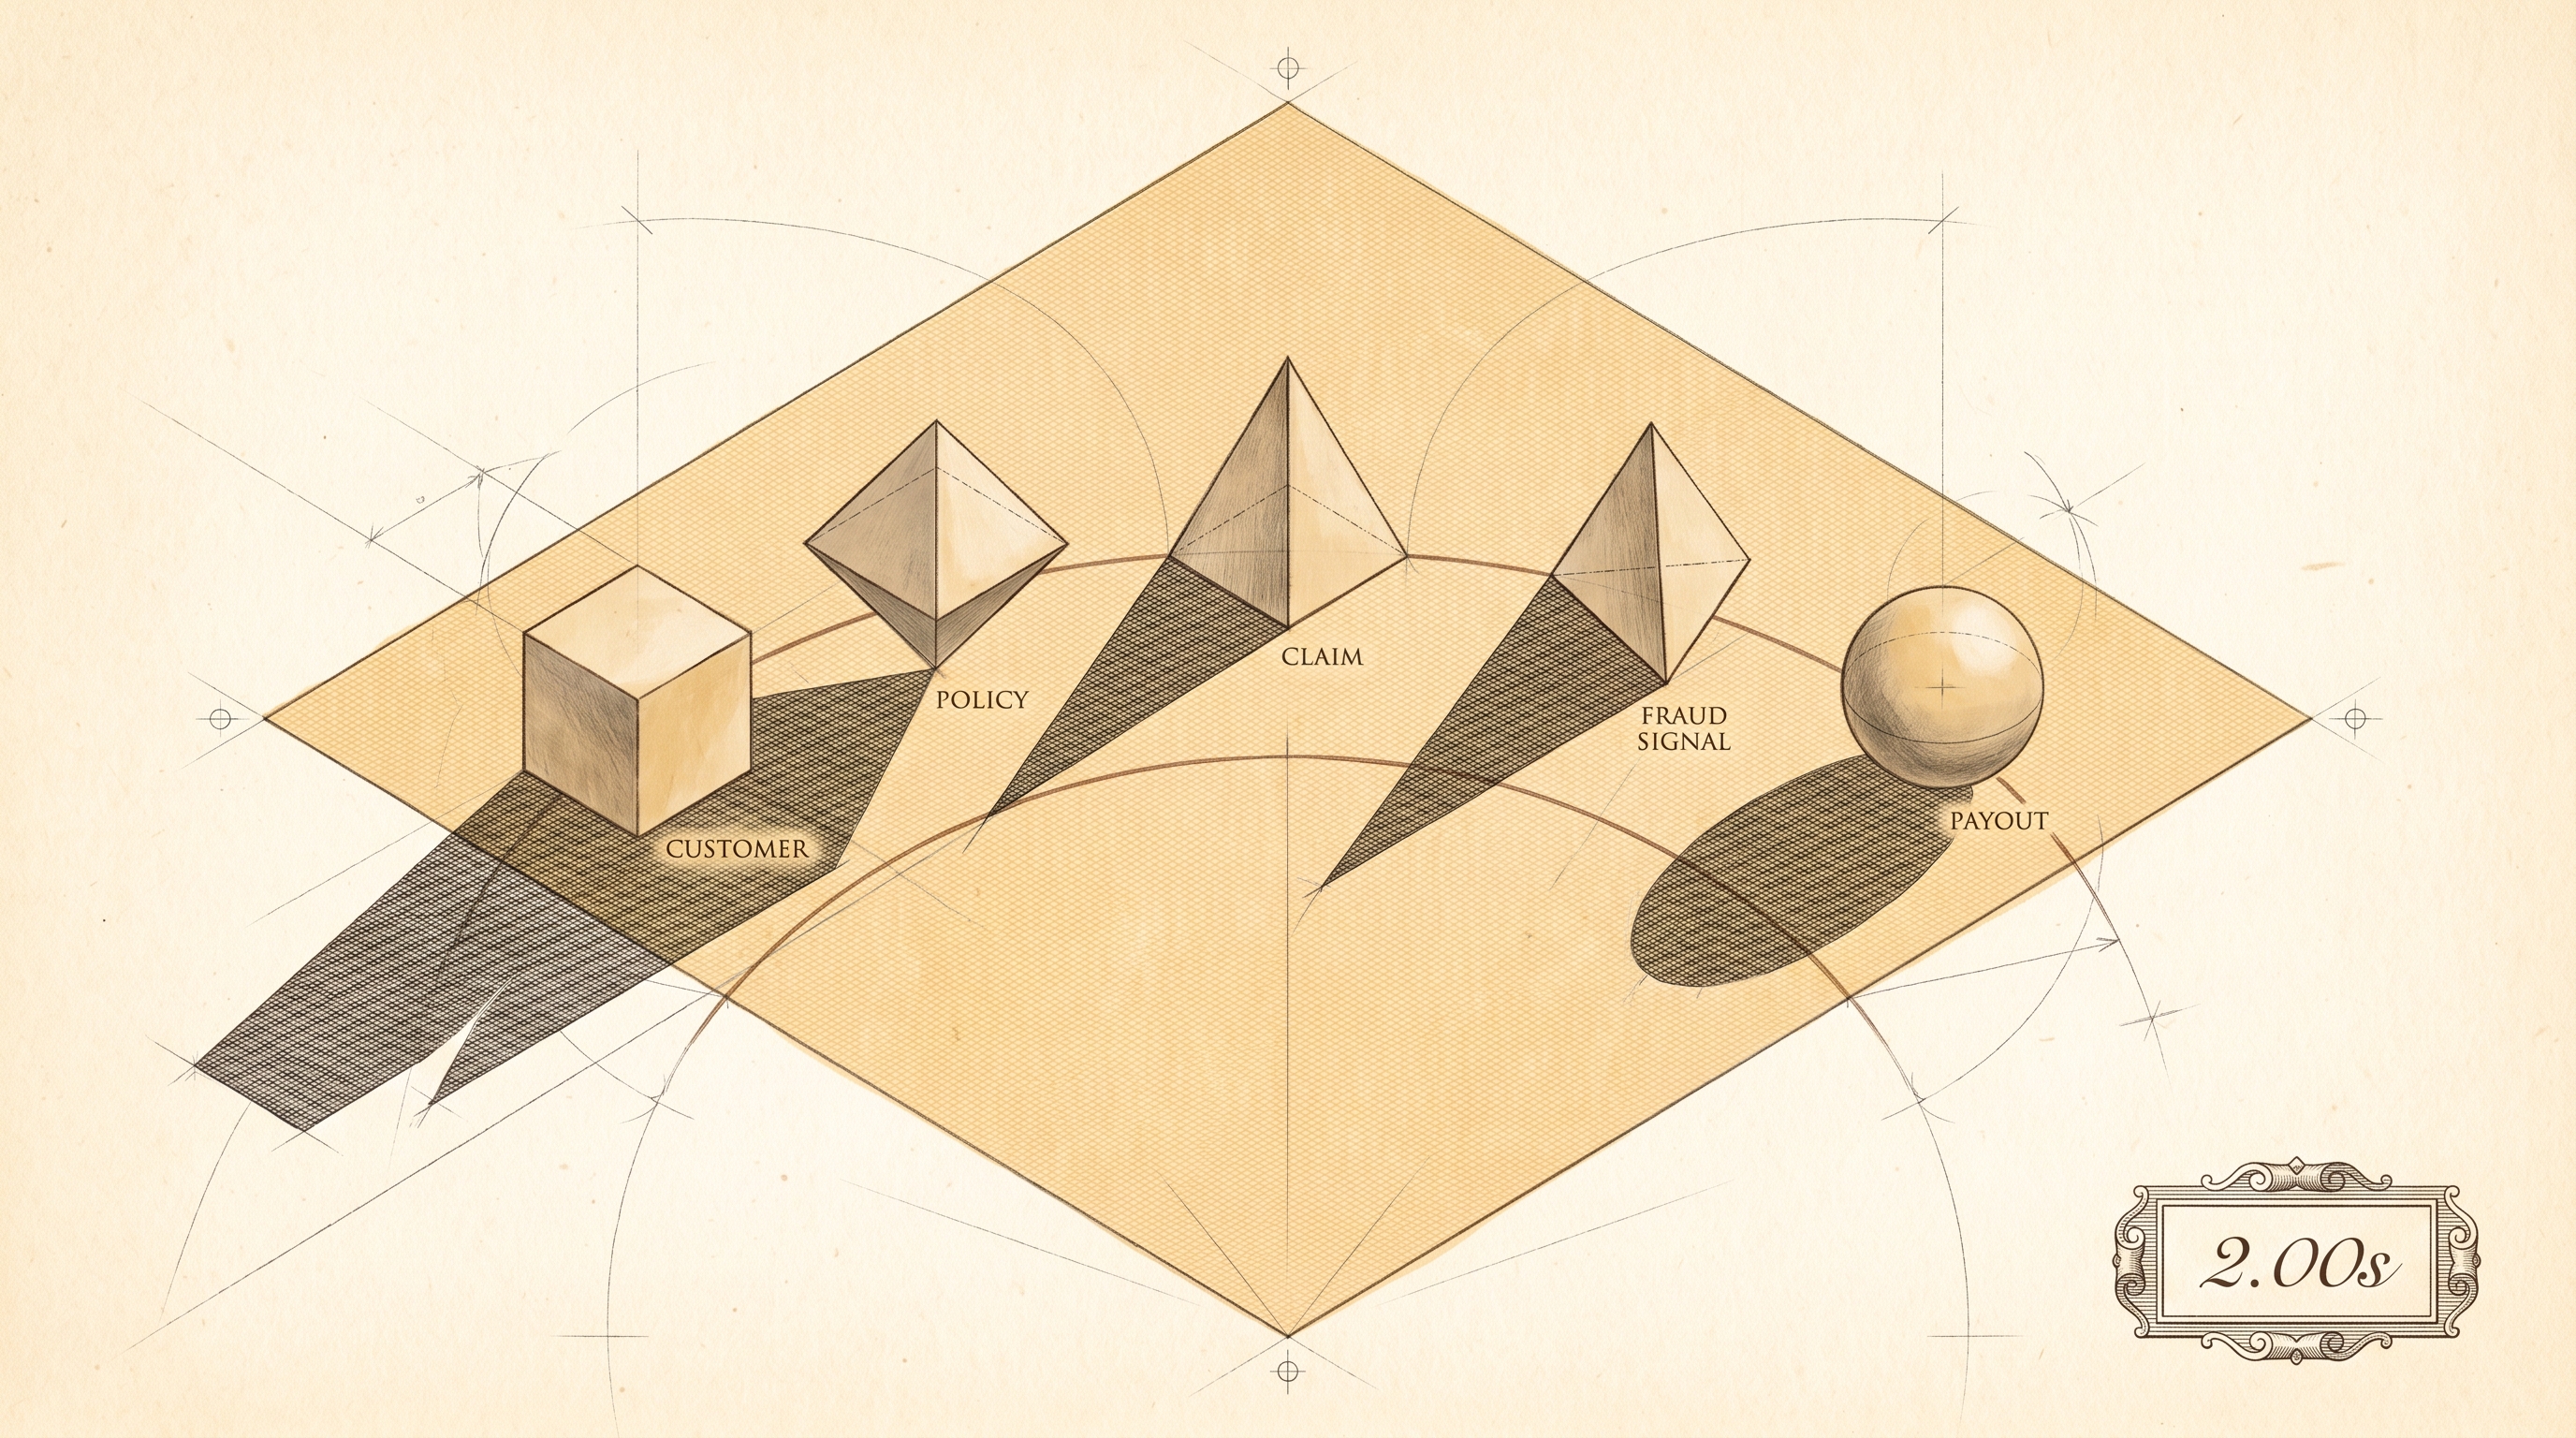
A graph-shaped model of who a customer is across the book. Household, broker relationship, policy history, claim behaviour, fraud signal - each an entity, each with edges to the others. The ontology is the vocabulary; every downstream query speaks it. It is not a data model to migrate to. It is a semantic overlay: a lens over the data you already own.
The point of connection
The ontology can point direct at the Policy Admin System, or over a warehouse or lakehouse if one is already in place. Neither is required for the other. The graph reads change events or scheduled extracts from the source systems and holds the current shape of the customer for query. Nothing migrates. The transactional systems are untouched.
The queries that matter
Household resolution across products. Broker introducer network mapping across the book. Fraud ring detection in the seam between two brands. Cross-sell probability tied to the shape of the household. These are the queries SQL over the tables does slowly or not at all; they are also the queries that turn the customer-purpose narrative into measurable growth.
The starting infrastructure is a managed graph database at £65 a month (AuraDB Professional). The ontology is a few dozen entity types and the edges between them. The ingest is change events or scheduled extracts from the Policy Admin System, or a read against the warehouse where one is already in place. The query language is Cypher. The answers land in seconds. Sign-offs stay inside your existing platform envelope.
Insurers who connected their analytics saw combined ratios 6 points lower and premium growth 3 points higher. That is a survey of 59 P&C carriers. The shape is not proprietary. The technology is in production across regulated finance. Your company owns everything that gets built.
Learn and believe in your abilities.
The answer is not a vendor. The answer is you.
Follow the Five Percent.